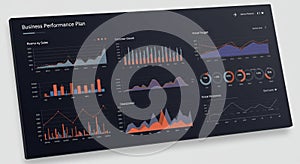
business performance dashboard displaying multiple graphs and charts features |
||||||||||||||||||||||||||||||||||||||||
navigate by keyword : visualizing trends time text targets signage screenshot sales revenue purple presentation poster pie performance perfect percentage organized orange multiple multimedia metrics matte line layout label include growth graphs generated gadget font financial features electronics dominant document distributions displaying diagram detailed design data dashboard dark customer colors clean charts business brand blue black bar banner background art analysis advertising actual |
||||||||||||||||||||||||||||||||||||||||
|
||||||||||||||||||||||||||||||||||||||||
Business performance dashboard displaying multiple graphs and charts. Features include line charts for revenue by sales and actual targets, bar graphs for customer growth, and pie charts for percentage distributions. Dominant colors are black, orange, blue, and purple on a matte dark background. The layout is clean, organized, and provides a detailed analysis of various business metrics. Perfect for visualizing financial data and performance trends over time. |
||||||||||||||||||||||||||||||||||||||||
Stockphotos.ro (c) 2025. All stock photos are provided by Dreamstime and are copyrighted by their respective owners. |