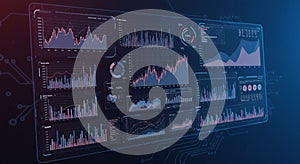
digital dashboard displaying various data analytics multiple charts and graphs |
||||||||||||||||||||||||||||||||||||||||
navigate by keyword : visualization utilized trends translucent tool tech suggesting subtle stage sleek signage show screenshot scheme resembles red presented predominant poster performance percentages music multiple multimedia metrics metric line likely light labels key interface intelligence indicates including hightech graphs gauge games gadget futuristic font fluctuating features environment enhancing electronics displaying digital design data dashboard darkness color coding circular |
||||||||||||||||||||||||||||||||||||||||
|
||||||||||||||||||||||||||||||||||||||||
Digital dashboard displaying various data analytics. Multiple charts and graphs, including bar and line charts, are presented on a sleek, translucent interface. Graphs show fluctuating data trends, percentages, and performance metrics, with axis labels and color coding. Central circular gauge likely indicates a key metric. Background features subtle circuit-like design, enhancing the tech aesthetic. Predominant color scheme is blue and red, suggesting a high-tech environment. Overall, the interface resembles a futuristic data visualization tool often utilized in business intelligence. |
||||||||||||||||||||||||||||||||||||||||
Stockphotos.ro (c) 2025. All stock photos are provided by Dreamstime and are copyrighted by their respective owners. |