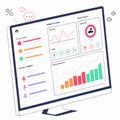
computer monitor displaying digital dashboard with various data visualizations

navigate by keyword : visualizations various user trends text statistics shades sections screenshot sales quick provide progress presentation pie performance patterns overview orange neatly multimedia monitor metrics line laptop labeled key interface insights indicators include image gray graphs gadget font features facilitating elements electronics document displaying digital diagram designed design data dashboard computer comprehensive circular charts brand blue bar arranged analysis

Computer monitor displaying a digital dashboard with various data visualizations. Royalty Free Stock Photo
Monitor displaying a futuristic digital dashboard with various data visualizations, Royalty Free Stock Photo
A large computer monitor displaying a complex data analytics dashboard. The Royalty Free Stock Photo
Computer monitor displaying a complex dashboard with various charts and graphs. Royalty Free Stock Photo
Cartoon doctor with A I medical dashboard and health data analytics Royalty Free Stock Photo
Modern Business Intelligence Dashboard on Computer Monitor Royalty Free Stock Photo
Data Analysis Dashboard on Computer Monitor Royalty Free Stock Photo
Computer monitor displaying a digital dashboard with various data visualizations.
Hand Interacting with Futuristic Dashboard Displaying Analytics Royalty Free Stock Photo
A man sits at a desk in an office setting, interacting with a large computer monitor Royalty Free Stock Photo
A computer monitor displaying various data visualizations and charts on a desk Royalty Free Stock Photo
Hand Interacting with Futuristic Dashboard Displaying Analytics Royalty Free Stock Photo
Illustration of a desktop monitor displaying various digital data visualizations, including charts and graphs Royalty Free Stock Photo
Computer monitor displaying a digital dashboard with various data visualizations. Features include circular progress charts, bar graphs, line graphs, and pie charts in shades of blue, orange, and gray. The interface is designed for data analysis, with sections labeled for sales, performance metrics, and user statistics. Elements are neatly arranged to provide a comprehensive overview of key performance indicators, facilitating quick insights into data trends and patterns.


Stockphotos.ro (c) 2025. All stock photos are provided by Dreamstime and are copyrighted by their respective owners.