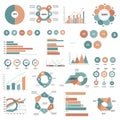
collection various infographic elements featuring bar graphs pie charts |
||||||||||||||||||||||||||||||||||||||||
navigate by keyword : visually values used types trends tones text teal style show screenshot reports relationships presentations presentation pie percentages pattern orange numerical number muted materials manner logo line information infographic illustrating icons highlight graphs graphics font featuring elements educational drawing document display diagrams diagram design data complex comparisons communicating commonly collection circular circle charts cartoon business brand bar aigenerator advertising accessible |
||||||||||||||||||||||||||||||||||||||||
|
||||||||||||||||||||||||||||||||||||||||
A collection of various infographic elements featuring bar graphs, pie charts, circular diagrams, and line charts in muted tones of orange and teal. These graphics display data with percentages, numerical values, and icons, illustrating different types of information and relationships. Circular elements highlight percentages, while bar and line graphs show trends and comparisons. This style is commonly used in business presentations, reports, and educational materials for visually communicating complex data in an accessible manner. |
||||||||||||||||||||||||||||||||||||||||
Stockphotos.ro (c) 2025. All stock photos are provided by Dreamstime and are copyrighted by their respective owners. |