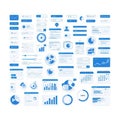
collection infographics featuring various data visualization elements |
||||||||||||||||||||||||||||||||||||||||
navigate by keyword : world white visually visualization text suitable suggesting screenshot presenting presentation poster points pie percentages palette organized orange one multimedia maps manner logo line learning layouts labels interactivity interacting infographics infographic incorporate include hands gray graphs games gadget font featuring engaging elements document display diagrams diagram designs design data color collection clear circular charts cartoon business brand blue bar balanced background analytical aigenerated advertising |
||||||||||||||||||||||||||||||||||||||||
|
||||||||||||||||||||||||||||||||||||||||
A collection of infographics featuring various data visualization elements. The designs include pie charts, bar graphs, line graphs, and circular diagrams, using a color palette of orange, blue, gray, and white. Some graphs incorporate world maps in the background, while others display data points with percentages and labels. Hands are shown interacting with one infographic, suggesting interactivity. The layouts are organized and visually balanced, suitable for presenting analytical or business data in a clear and engaging manner. |
||||||||||||||||||||||||||||||||||||||||
Stockphotos.ro (c) 2025. All stock photos are provided by Dreamstime and are copyrighted by their respective owners. |