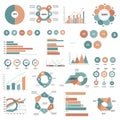
collection infographic elements featuring various charts and graphs this |
||||||||||||||||||||||||||||||||||||||||
navigate by keyword : visualization text teal symbols suitable signify show sections screenshot schemes representing presentations presentation plan pie orange modern metrics map logo line like lightbulb layout infographic incorporated includes illustrations ideas icons human graphs font featuring elements drawing document distinct displays diagram design data connected concepts color collection circle charts categories cartoon brand black bar area annotated aigenerated advertising |
||||||||||||||||||||||||||||||||||||||||
|
||||||||||||||||||||||||||||||||||||||||
A collection of infographic elements featuring various charts and graphs. This includes pie charts, bar graphs, line graphs, and area graphs, each with distinct color schemes of teal, orange, and black. Human icons and lightbulb illustrations are incorporated to signify concepts like ideas and data. Several sections show annotated charts with connected symbols representing different categories or metrics. The layout displays a modern design, suitable for data visualization in presentations. |
||||||||||||||||||||||||||||||||||||||||
Stockphotos.ro (c) 2025. All stock photos are provided by Dreamstime and are copyrighted by their respective owners. |