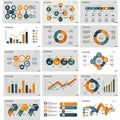
collection data visualizations featuring various types graphs and charts line

navigate by keyword : writing visualizations types trends text statistical sections representation represent red readability presentation poster pie performance pattern paper organized money metrics lines line likely light label key hues handwriting grid graphs graphical generated font focus featuring enhancing emphasizing drawing document display differentiation diagram design data currency comparative color collection clarity charts categories cash brand blue bar background art arranged approach analysis advertising

A collection of data visualizations featuring various types of graphs and charts. Line Royalty Free Stock Photo
A collection of data visualizations featuring various graph types, including bar charts, Royalty Free Stock Photo
Collection of infographics featuring various chart types and data visualizations Royalty Free Stock Photo
Collection of infographics featuring various chart types including line graphs, pie Royalty Free Stock Photo
A collection of data visualizations in shades of blue and orange, featuring various Royalty Free Stock Photo
   
   
A collection of data visualizations featuring various types of graphs and charts. Line
A collection of dark-themed data visualizations and infographics featuring various Royalty Free Stock Photo
Collection colorful isometric 3D graphs charts including bar, line, pie graphs, good presentation Royalty Free Stock Photo


A detailed collection of data visualizations on a dark background, featuring various Royalty Free Stock Photo
Collection colorful isometric 3D graphs charts including bar, line, pie graphs, good presentation Royalty Free Stock Photo
A collection of data visualizations featuring various types of graphs and charts. Line graphs, bar charts, and pie charts display data trends in red and blue hues. Key metrics and categories are organized in sections with grid lines for clarity. The visualizations likely represent statistical data analysis or performance metrics, emphasizing a comparative approach through color differentiation and graphical representation. The charts are arranged on a light background, enhancing readability and focus on the data.


Stockphotos.ro (c) 2025. All stock photos are provided by Dreamstime and are copyrighted by their respective owners.