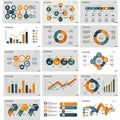
collection data visualizations shades blue and orange featuring various |
||||||||||||||||||||||||||||||||||||||||
navigate by keyword : visualizations visual vehicle user types type text shades sections screenshot sales presented presentation pie performance percentages organized orange multimedia metrics logo line like layout insights information includes icons growth graphs font featuring enhance elements drawing document distinct diagrams diagram depict demographics data convey collection clarity circle charts cartoon brand blue bar arrows analytical analysis aigenerated advertising |
||||||||||||||||||||||||||||||||||||||||
|
||||||||||||||||||||||||||||||||||||||||
A collection of data visualizations in shades of blue and orange, featuring various types of charts and graphs. Includes bar charts, pie charts, and line graphs with different metrics and percentages. Icons and diagrams depict user demographics, sales growth, and performance analysis. The layout is organized to convey analytical insights, with distinct sections for each data type. Visual elements like arrows and icons enhance the clarity of the information presented. |
||||||||||||||||||||||||||||||||||||||||
Stockphotos.ro (c) 2025. All stock photos are provided by Dreamstime and are copyrighted by their respective owners. |