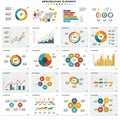
vibrant data infographic with pie charts and bar graphs blue orange |
||||||||||||||||||||||||||||||||||||||||
| navigate by keyword : data chart pie donut ring bar bars visual infographic graphic graph analytics analysis insight metrics report dashboard presentation business finance growth trend kpi performance market statistics statistic concept design color blue orange viz visualization charting diagram vector information template bold colorful featuring charts stacked ideal reports digital dashboards vibrant graphs |
||||||||||||||||||||||||||||||||||||||||
|
||||||||||||||||||||||||||||||||||||||||
| A bold, colorful data visualization featuring pie charts, ring charts, and stacked bars in blue and orange. Ideal for analytics, statistics, business reports, and digital dashboards. |
||||||||||||||||||||||||||||||||||||||||
|
Stockphotos.ro (c) 2025. All stock photos are provided by Dreamstime and are copyrighted by their respective owners. |
||||||||||||||||||||||||||||||||||||||||