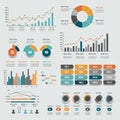
infographic displaying various elements for data visualization includes pie charts |
||||||||||||||||||||||||||||||||||||||||
navigate by keyword : world visualization vibrant trends time textual text show sets screenshot represent red provide presentation pie person percentages organized orange number multimedia map logo lists line like layout information infographic indicate includes icons highlights hexagonal grid graphs globally font ensuring elements easy drawing document distribution displaying diagrams diagram design data comprehension complex colors clarity circular circle charts categories cartoon brand blue bar aigenerator advertising |
||||||||||||||||||||||||||||||||||||||||
|
||||||||||||||||||||||||||||||||||||||||
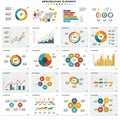
An infographic displaying various elements for data visualization. Includes pie charts, bar graphs, line graphs, and hexagonal diagrams with vibrant colors like red, blue, and orange. A world map highlights data distribution globally. Circular and hexagonal charts show percentages, while line charts indicate trends over time. Icons represent different data categories, and lists provide textual information. The design is organized in a grid layout, ensuring clarity and easy comprehension of complex data sets. |
||||||||||||||||||||||||||||||||||||||||
Stockphotos.ro (c) 2025. All stock photos are provided by Dreamstime and are copyrighted by their respective owners. |