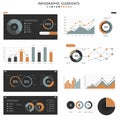
infographic displaying various data visualization elements white background |
||||||||||||||||||||||||||||||||||||||||
navigate by keyword : white wheel visualization visual vehicle textual text sets screenshot represents prominently presentation pie percentage palette organization orange multimedia monochromatic markers logo line legend labels interpretation infographic indicators includes gray graphs graph font elements easy drawing document displaying display diagram designed design descriptions data connectors clarity circular circle charts cartoon car brand black bar background aigenerated advertising additional |
||||||||||||||||||||||||||||||||||||||||
|
||||||||||||||||||||||||||||||||||||||||
Infographic displaying various data visualization elements on a white background. Includes pie charts, line graphs, and bar graphs in a monochromatic palette of black, orange, and gray. Each graph represents different data sets with percentage indicators, line connectors, and legend markers for organization. Circular graphs display percentage labels prominently, with additional textual descriptions beside certain charts. Designed for easy interpretation and visual clarity. |
||||||||||||||||||||||||||||||||||||||||
Stockphotos.ro (c) 2025. All stock photos are provided by Dreamstime and are copyrighted by their respective owners. |