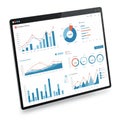
tablet screen displaying data analytics with charts and graphs bar chart line

navigate by keyword : writing used usage top text tablet suggests shows setting sets screenshot screen scene right presentation present poster pie performance orange multimedia metrics marketing line likely learning interacts insights indicating include illustrating hand graphs graph generated gadget font focused evaluating email electronics document distribution displaying digital design data corner colors charts chart campaign business brand blue black bar art analytics analysis advertising

Tablet screen displaying data analytics with charts and graphs. A bar chart and a line Royalty Free Stock Photo
Tablet screen displaying various data visualizations, including bar charts, line graphs, Royalty Free Stock Photo
A tablet displaying a data analytics interface with charts, graphs, and numerical Royalty Free Stock Photo
Tablet displaying various colorful graphics, including bar graphs, line charts, and a pie Royalty Free Stock Photo
Tablet displaying a KPI dashboard with various charts and graphs. The screen shows Royalty Free Stock Photo
Person holding tablet displaying financial data charts and graphs analysis Royalty Free Stock Photo
Modern digital tablet displaying data visualization charts and graphs for business analytics and reporting Royalty Free Stock Photo
Tablet screen displaying data analytics with charts and graphs. A bar chart and a line
A workspace featuring a laptop and a tablet displaying data analytics and graphs. Royalty Free Stock Photo
Digital screen displaying financial data, featuring multiple graphs and charts including Royalty Free Stock Photo
Magnifying glass on digital screen displaying financial charts and data analysis Royalty Free Stock Photo
Modern digital tablet displaying data visualization charts and graphs for business analytics and reporting Royalty Free Stock Photo
A tablet displaying a comprehensive dashboard with various data visualizations. It Royalty Free Stock Photo
A hand interacts with a touchscreen displaying various data visualizations. The screen Royalty Free Stock Photo
Two screens display data visualizations. The larger screen shows three charts: a line Royalty Free Stock Photo
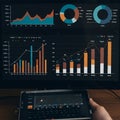
Tablet screen displaying data analytics with charts and graphs. A bar chart and a line graph are shown, illustrating email campaign data insights. A hand interacts with the screen, indicating usage in data analysis or presentation. Pie chart present in the top right corner shows data distribution. Colors used include orange, blue, and black, likely for different data sets or metrics. The scene suggests a business or marketing setting focused on evaluating digital performance.


Stockphotos.ro (c) 2025. All stock photos are provided by Dreamstime and are copyrighted by their respective owners.