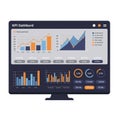
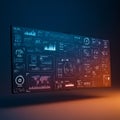
multiple graphs and charts display various data visualizations digital interface |
||||||||||||||||||||||||||||||||||||||||
navigate by keyword : white visualizations visible tones text suggesting stage signage segments screenshot screen red poster points pink pie performance night music multiple modern metrics lines line light labels interpretation interface histograms graphs futuristic font financial featuring entertainment emphasizing display digital design data darkness crowd concert charts bars bar axes arranged analytical analysis aigenerated aesthetic advertising |
||||||||||||||||||||||||||||||||||||||||
|
||||||||||||||||||||||||||||||||||||||||
Multiple graphs and charts display various data visualizations on a digital interface. Line charts, bar graphs, pie charts, and histograms are arranged across the screen, featuring lines, bars, and segments in pink, white, and red tones. Data points, axes, and labels are visible, suggesting analytical or financial metrics. The overall design has a modern and futuristic aesthetic, emphasizing digital data analysis and interpretation. |
||||||||||||||||||||||||||||||||||||||||
Stockphotos.ro (c) 2025. All stock photos are provided by Dreamstime and are copyrighted by their respective owners. |