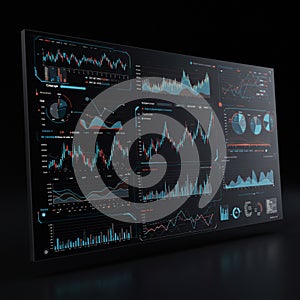
digital dashboard display features multiple data visualizations including bar graphs |
||||||||||||||||||||||||||||||||||||||||
navigate by keyword : web visualizations vibrant trends text synthesis symmetrical suggests stage spider signage show setting sections screenshot screen red providing presentation poster pie organized neatly multiple multimedia monitoring metrics lines line light interface information including hightech hangs graphs glistening games gadget foreground font fluctuations features environment emphasizing electronics display digital dew detailed design data dashboard dark command charts center brand blue bar appearance analytical analysis |
||||||||||||||||||||||||||||||||||||||||
|
||||||||||||||||||||||||||||||||||||||||
A digital dashboard display features multiple data visualizations, including bar graphs, line graphs, and pie charts. The screen is dark with vibrant blue and red lines, providing a high-tech appearance. Various sections show fluctuations, trends, and analytical metrics, organized neatly across the interface. The setting suggests a command center or data analysis environment, emphasizing detailed monitoring and information synthesis. |
||||||||||||||||||||||||||||||||||||||||
Stockphotos.ro (c) 2025. All stock photos are provided by Dreamstime and are copyrighted by their respective owners. |