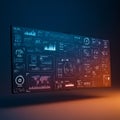
multiple digital screens display various data visualizations including line graphs bar |
||||||||||||||||||||||||||||||||||||||||
navigate by keyword : visualizations text suggesting sophisticated signage shows shades sets screenshot screens screen scheme room reflecting quantitative professional presentation presence poster points pie orange office numbers number multiple multimedia monitoring metrics line light indicative including hightech highlights graphs games gadget font financial features environment display digital design data darkness dark control complex color charts business brand blue black bar background arrangement |
||||||||||||||||||||||||||||||||||||||||
|
||||||||||||||||||||||||||||||||||||||||
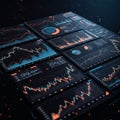
Multiple digital screens display various data visualizations, including line graphs, bar charts, and pie charts. The color scheme features shades of orange and blue against a dark background. Each screen shows different sets of complex data points and analytics, reflecting financial or business metrics. The arrangement is sophisticated, suggesting a high-tech or professional environment, possibly an office or control room. The presence of charts and numbers highlights analytical and quantitative content, indicative of data monitoring and analysis. |
||||||||||||||||||||||||||||||||||||||||
Stockphotos.ro (c) 2025. All stock photos are provided by Dreamstime and are copyrighted by their respective owners. |