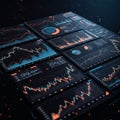
multiple digital screens display complex data visualizations and graphs including line |
||||||||||||||||||||||||||||||||||||||||
navigate by keyword : visualizations trends time text summaries suitable statistical stage signage show screenshot screens scheme scales representing purple presentation predictive poster pie performance numerical number night multiple metrics market line light legend insights indicators indicate including graphs graph generated futuristic font fluctuating financial display digital detailed design data darkness creating complex comparisons color charts brand blue bar analytical analytic ambiance advertising |
||||||||||||||||||||||||||||||||||||||||
|
||||||||||||||||||||||||||||||||||||||||
Multiple digital screens display complex data visualizations and graphs, including line charts, bar graphs, and pie charts with financial metrics. The color scheme is predominantly blue, creating a futuristic and analytic ambiance. The line graphs show fluctuating trends, possibly representing market data or stock performance over time. Pie charts and bar graphs indicate various comparisons and statistical summaries. Each graph is detailed with numerical scales and legend indicators, suitable for analytical and predictive insights. |
||||||||||||||||||||||||||||||||||||||||
Stockphotos.ro (c) 2025. All stock photos are provided by Dreamstime and are copyrighted by their respective owners. |