infographic with various data visualization elements including bar graphs line charts |
||||||||||||||||||||||||||||||||||||||||
| navigate by keyword : yellow visualization upward trends text statistical show sections screenshot scheme red ranked providing presentation poster points play pie percentage pattern overview organized orange number neatly multiple logo line labels information infographic indicating including inaigeneratedfographic illustrate horizontal graphs font features exhibit elements drawing document divisions display diagrams diagram design data comprehensive comparative color circular circle charts cartoon brand bar |
||||||||||||||||||||||||||||||||||||||||
|
||||||||||||||||||||||||||||||||||||||||
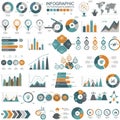
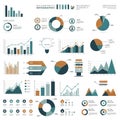
| Infographic with various data visualization elements, including bar graphs, line charts, and pie charts. Features a color scheme of blue, orange, red, and yellow. Some charts show upward trends, others display comparative data, with labels indicating different sections or data points. Circular diagrams exhibit percentage divisions, while horizontal bars illustrate ranked information. Content is organized neatly across multiple sections, providing a comprehensive overview of statistical data. |
||||||||||||||||||||||||||||||||||||||||
|
Stockphotos.ro (c) 2025. All stock photos are provided by Dreamstime and are copyrighted by their respective owners. |
||||||||||||||||||||||||||||||||||||||||