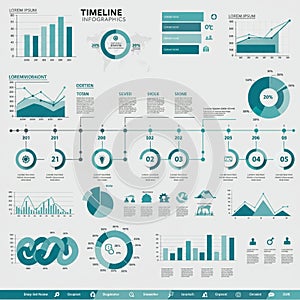
infographic showcasing various data visualization elements including bar charts line |
||||||||||||||||||||||||||||||||||||||||
navigate by keyword : wellstructured visualization timeline text teal space silhouette showcasing settings sections screenshot scheme representing purpose providing presentation placeholder pie percentages people number multimedia modern milestones lorem logo line layout labeling label ipsum interpretation informative infographic including illustrative icons graphs generated font features events emphasizing elements drawing document diagram design depicting data comparisons color clean circular circle charts categories cartoon brand bar ample advertising accompanied |
||||||||||||||||||||||||||||||||||||||||
|
||||||||||||||||||||||||||||||||||||||||
Infographic showcasing various data visualization elements, including bar charts, line graphs, pie charts, and a timeline. The design uses a teal color scheme, emphasizing categories, percentages, and comparisons. The timeline features circular icons representing different events or milestones. There are also silhouette icons depicting people and settings. The layout is well-structured, labeling sections, providing ample space for data interpretation, and accompanied by placeholder text, "Lorem Ipsum," for illustrative purpose. The overall design is clean, modern, and informative. |
||||||||||||||||||||||||||||||||||||||||
Stockphotos.ro (c) 2025. All stock photos are provided by Dreamstime and are copyrighted by their respective owners. |