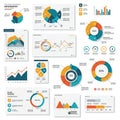
infographic layout featuring various data visualizations including line graphs bar |
||||||||||||||||||||||||||||||||||||||||
navigate by keyword : visualizations vary used trends time text teal symbols suitable suggesting statistical sketch show segments screenshot scheme representing presenting presentation points plan pie percentages people orange numerical navy multimedia modern map logo line layout labeled intersecting information infographic indicate including includes illustrating height graphs font financial figures featuring drawing dollar document distributions diagrams diagram design depict demographic data comparisons color clean clarity circular circle charts bar |
||||||||||||||||||||||||||||||||||||||||
|
||||||||||||||||||||||||||||||||||||||||
Infographic layout featuring various data visualizations, including line graphs, bar charts, and pie charts. The color scheme includes teal, orange, and navy blue. Circular diagrams indicate percentages with segments labeled for clarity. Bar charts vary in height, illustrating numerical comparisons over time, while line graphs show trends with intersecting points. Dollar symbols appear within some circular charts, suggesting financial data. Figures representing people are used to depict demographic distributions. The design is clean and modern, suitable for presenting statistical information. |
||||||||||||||||||||||||||||||||||||||||
Stockphotos.ro (c) 2025. All stock photos are provided by Dreamstime and are copyrighted by their respective owners. |