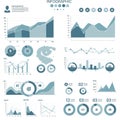
infographic featuring various statistical charts including bar graphs pie and |
||||||||||||||||||||||||||||||||||||||||
| navigate by keyword : yellow values text suggesting stem statistical sets scum screenshot scales represent red ranges presentation poster pie percentages pattern numerical multiple logo line like layout information infographic including grid graphs format font featuring drawing document diverse displaying display diagram design datasets data comparison colors circle charts chart categories cartoon brand blue bar banner axis arranges |
||||||||||||||||||||||||||||||||||||||||
|
||||||||||||||||||||||||||||||||||||||||
| Infographic featuring various statistical charts, including bar graphs, pie charts, and line graphs. Each chart uses multiple colors such as blue, red, and yellow to represent different data sets. The charts display information about categories like "Axis", "Stem", and "Scum," among others. The data ranges are shown with different scales, with some charts displaying numerical values and percentages. The layout arranges the charts in a grid format, suggesting a comparison of diverse datasets. |
||||||||||||||||||||||||||||||||||||||||
|
Stockphotos.ro (c) 2025. All stock photos are provided by Dreamstime and are copyrighted by their respective owners. |
||||||||||||||||||||||||||||||||||||||||