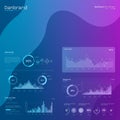
futuristic data visualization interface featuring various analytical graphs and charts

navigate by keyword : visualization visual theme text technology suggests statistics signage show shapes screenshot screen purple protrude presentation poster percentage number multimedia logo line layout interface intelligence include hexagonal graphs generated gadget futuristic font fluctuating featuring elements displaying digital diagram design depth data dark combining circular circle charts business brand blue bar background analytics analytical advertising adding abstract

Futuristic data visualization interface featuring various analytical graphs and charts Royalty Free Stock Photo
Futuristic digital dashboard featuring various data visualization elements: line graphs, Royalty Free Stock Photo
High-tech, digital interface featuring various data visualization elements such as Royalty Free Stock Photo
Futuristic digital interface featuring multiple data panels on a black circuit-like Royalty Free Stock Photo
Abstract digital dashboard featuring various data visualization elements, including pi Royalty Free Stock Photo
   
   
Futuristic data visualization interface featuring various analytical graphs and charts
Advanced Data Visualization Dashboard - Futuristic Interface Royalty Free Stock Photo
Futuristic Digital Dashboard with Orange and Dark Interface Showing Data Points and Graphs Royalty Free Stock Photo
   
A holographic display visualizing projected market trends derived from current analytical data. Royalty Free Stock Photo
Businessman interacting with futuristic digital dashboard displaying data visualizations Royalty Free Stock Photo
Dark Mode Dashboard Interface Royalty Free Stock Photo
Futuristic Dashboard Displaying Clean Interface With Various Charts and Soft Blur Effects for Analytical Insights Royalty Free Stock Photo
Futuristic data visualization interface featuring various analytical graphs and charts against a dark blue background. Hexagonal shapes in 3D protrude from the screen, adding depth. Graphs include line charts and bar charts, displaying fluctuating data. Circular visual elements show percentage statistics. Layout suggests a digital analytics or business intelligence theme, combining technology with abstract design.


Stockphotos.ro (c) 2025. All stock photos are provided by Dreamstime and are copyrighted by their respective owners.