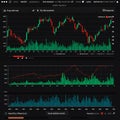
financial chart with candlestick patterns line graphs and bar charts grid |
||||||||||||||||||||||||||||||||||||||||
navigate by keyword : white volume visual trends trading text suitable suggests stage specific skyscraper signage screenshot representation represent reflection poster points patterns orange offering night modern markets market lines line lighting light illustrating highlights growth grid graphs font focus fluctuations financial emphasize economic dynamics digital design depict datadriven data darkness contexts complex circular charts chart candlestick blue bars bar background art analysis aigenerated aesthetic advertising abstract |
||||||||||||||||||||||||||||||||||||||||
|
||||||||||||||||||||||||||||||||||||||||
Financial chart with candlestick patterns, line graphs, and bar charts on a grid background. Blue bars represent volume changes, while orange and white lines depict market trends and fluctuations. Circular highlights emphasize specific data points, illustrating growth and analysis. The abstract digital design suggests a focus on financial markets, stock trading, or data analysis, offering a visual representation of complex market dynamics. The overall aesthetic is modern and data-driven, suitable for financial or economic contexts. |
||||||||||||||||||||||||||||||||||||||||
Stockphotos.ro (c) 2025. All stock photos are provided by Dreamstime and are copyrighted by their respective owners. |