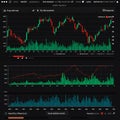
graphic interface displaying multiple financial charts with data visualizations the |
||||||||||||||||||||||||||||||||||||||||
navigate by keyword : volume visualizations top tool text signage shows segment screenshot red readability presented presentation patterns overlaid options number navigation multiple multimedia middle market line interface indicating includes icons grid green graphs graphic graph games gadget font financial features enhancing elements electronics document displaying diagram data dark complex charts chart candlestick brand bottom blue bars bar background analysis aigenerated accompanying |
||||||||||||||||||||||||||||||||||||||||
|
||||||||||||||||||||||||||||||||||||||||
A graphic interface displaying multiple financial charts with data visualizations. The top chart features red and green candlestick patterns with accompanying volume bars in green. The middle section includes line graphs in red and green overlaid on a grid, while the bottom segment shows a bar graph with blue bars. Navigation elements, various icons, and options for analysis are presented at the top and bottom, indicating a complex financial or stock market analysis tool. The background is dark, enhancing readability. |
||||||||||||||||||||||||||||||||||||||||
Stockphotos.ro (c) 2025. All stock photos are provided by Dreamstime and are copyrighted by their respective owners. |