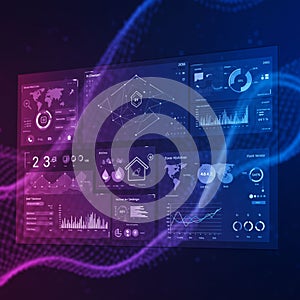
digital interface displaying data analytics and visualizations dashboard includes |
||||||||||||||||||||||||||||||||||||||||
navigate by keyword : world wave visualizations visual touch themes text technology suitable statistics stage signage screenshot purple presentation number network neon multimedia modern metrics maps line lighting light interface includes hues graphs gradient gadget font flowing feature elements dynamic displaying digital diagrams design data dashboard charts brand blue bar background analytics aigenerated advertising adding |
||||||||||||||||||||||||||||||||||||||||
|
||||||||||||||||||||||||||||||||||||||||
Digital interface displaying data analytics and visualizations on a dashboard. Includes bar charts, line graphs, and world maps in a gradient of blue and purple hues. Visual elements feature network diagrams, statistics, and various data metrics. The background has a flowing wave design, adding a dynamic and modern touch. Suitable for technology, AI, and analytics themes. |
||||||||||||||||||||||||||||||||||||||||
Stockphotos.ro (c) 2025. All stock photos are provided by Dreamstime and are copyrighted by their respective owners. |