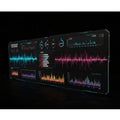
digital dashboard interface displaying various data visualizations black and |
||||||||||||||||||||||||||||||||||||||||
navigate by keyword : visualizations usage text technological systems suitable streams speed signage sets screenshot scientific scheme resembling reminiscent rectangular realtime present pie performance numerical number multimedia monitoring metrics line light levels interface includes illustrating green graphs generated games gadget font financial features electronics displaying display digital dials data dashboard darkness contexts computer color code circular charts center brand black binary bar appearance analytics analysis advertising advanced |
||||||||||||||||||||||||||||||||||||||||
|
||||||||||||||||||||||||||||||||||||||||
A digital dashboard interface displaying various data visualizations in a black and green color scheme. It includes line graphs, bar charts, and pie charts, each illustrating different data sets and analytics. The center features green numerical data resembling binary code, reminiscent of computer systems or financial data streams. Circular dials and rectangular graphs present metrics such as speed, performance, or usage levels. The display has an advanced, scientific appearance, suitable for real-time data monitoring and analysis in technological or financial contexts. |
||||||||||||||||||||||||||||||||||||||||
Stockphotos.ro (c) 2025. All stock photos are provided by Dreamstime and are copyrighted by their respective owners. |