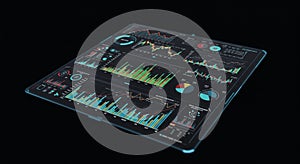
digital dashboard displaying multiple data visualizations sleek black interface |
||||||||||||||||||||||||||||||||||||||||
navigate by keyword : visualizations trends text techdriven tasks suggests sleek signage showing screenshot presentation poster pie pattern number neatly multiple multimedia line interpretation interface interactive including ideal holographic hightech grid graphs generated games gadget futuristic font facilitating environment elements electronics easy displaying digital design data dashboard comparisons colorcoded charts brand black bar arranged appears appearance analysis advertising |
||||||||||||||||||||||||||||||||||||||||
|
||||||||||||||||||||||||||||||||||||||||
A digital dashboard displaying multiple data visualizations on a sleek black interface. Graphs and charts, including bar graphs, line charts, and pie charts, are color-coded, showing various data trends and comparisons. The holographic appearance suggests a high-tech, futuristic design. These elements are arranged neatly in a grid pattern, facilitating easy analysis and interpretation of the data. The interface appears interactive, ideal for data analysis tasks in a tech-driven environment. |
||||||||||||||||||||||||||||||||||||||||
Stockphotos.ro (c) 2025. All stock photos are provided by Dreamstime and are copyrighted by their respective owners. |