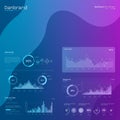
digital dashboard interface featuring various data visualization elements including |
||||||||||||||||||||||||||||||||||||||||
navigate by keyword : white visualization tool text structured statistical signage sign serves sections reporting presentation poster pie perspective performance percentages pattern organized orange number monitoring modern metrics logo line likely layout label interface information indicators including graphs font featuring emphasizing elements document distinct display digital diagram designed design data dashboard composition colors clean charts cartoon calligraphy brand bar banner art angled analytics aigenerated |
||||||||||||||||||||||||||||||||||||||||
|
||||||||||||||||||||||||||||||||||||||||
A digital dashboard interface featuring various data visualization elements, including pie charts, bar graphs, and line graphs. The design predominantly uses orange and white colors with a clean layout. The graphs display information such as percentages and statistical data, organized in distinct sections. The interface likely serves as an analytics or reporting tool, designed for monitoring metrics and performance indicators. The composition is shown from an angled perspective, emphasizing the structured and modern design. |
||||||||||||||||||||||||||||||||||||||||
Stockphotos.ro (c) 2025. All stock photos are provided by Dreamstime and are copyrighted by their respective owners. |