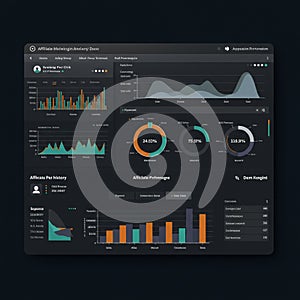
digital dashboard design featuring data analytics elements dark interface |
||||||||||||||||||||||||||||||||||||||||
navigate by keyword : visualization visual user trends transaction top time text teal structured shows shades sections screenshot scheme representing realtime providing presentation poster performance percentages orange number multimedia monitoring metrics line like layout involves interpretation interface indicating including include history gray graphs generate games gadget forms font fluctuating featuring elements electronics easy earnings donut document displays digital diagram design data dashboard dark contrast comprehensive color click charts brand |
||||||||||||||||||||||||||||||||||||||||
|
||||||||||||||||||||||||||||||||||||||||
Digital dashboard design featuring data analytics elements on a dark interface. Displays various forms of data visualization, including bar graphs, line charts, and donut charts representing metrics like 'Earnings Per Click' and performance percentages. The top section shows fluctuating line graphs, indicating trends over time. Different sections include user data and transaction history. Color scheme involves shades of orange, teal, and gray, providing visual contrast for easy data interpretation. Layout is structured for comprehensive analysis and real-time monitoring. |
||||||||||||||||||||||||||||||||||||||||
Stockphotos.ro (c) 2025. All stock photos are provided by Dreamstime and are copyrighted by their respective owners. |