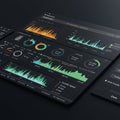
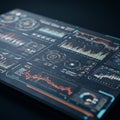
digital dashboard featuring various charts and graphs with dark theme orange |
||||||||||||||||||||||||||||||||||||||||
navigate by keyword : user used theme text structured statistics social smartphone separations screenshot screen readability rates purposes primary presentation present poster pie performance orange number multimedia metrics media marketing line likely layout labels label interface insights information including graphs generated gadget font featuring enhances engagement electronics document display digital diagram designed design data dashboard dark colors clear clean charts business brand blue bar appears analytical advertising |
||||||||||||||||||||||||||||||||||||||||
|
||||||||||||||||||||||||||||||||||||||||
A digital dashboard featuring various charts and graphs with a dark theme. Orange and blue are the primary colors used to display data metrics, including line graphs, bar charts, and pie charts. The layout is structured to present information such as engagement rates, social media performance, and user statistics. The clean design with clear separations and labels enhances data readability on the screen. The interface appears designed for analytical insights, likely for business or marketing purposes. |
||||||||||||||||||||||||||||||||||||||||
Stockphotos.ro (c) 2025. All stock photos are provided by Dreamstime and are copyrighted by their respective owners. |