data visualization layout featuring various charts and graphs including line bar |
||||||||||||||||||||||||||||||||||||||||
navigate by keyword : visualization text suggesting statistics shades sets sections screenshot represent presentation pie performance percentages organized number multimedia metrics look logo line layout labels label including implying icons headings handwriting gray graphs graphical gadget font focus featuring drawing document diagram design data cohesive clean circular circle charts categories business brand bottom blue bar arrangement analytics aigenerated advertising actions accompanied |
||||||||||||||||||||||||||||||||||||||||
|
||||||||||||||||||||||||||||||||||||||||
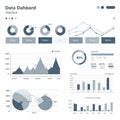
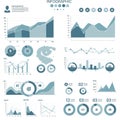
Data visualization layout featuring various charts and graphs, including line and bar graphs, pie charts, and circle graphs. The design uses shades of blue and gray for a cohesive look. Circular icons at the bottom represent different categories or actions, accompanied by text labels. The content is organized into sections with headings, suggesting different data sets. The arrangement is clean, with graphical data on performance, percentages, and statistics, implying a focus on analytics or business metrics. |
||||||||||||||||||||||||||||||||||||||||
Stockphotos.ro (c) 2025. All stock photos are provided by Dreamstime and are copyrighted by their respective owners. |