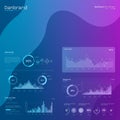
data visualization interface with various charts and graphs blue gradient |
||||||||||||||||||||||||||||||||||||||||
navigate by keyword : visually visualization trend text small signage screenshot representing red provide presentation poster points pie numeric multimedia logo lines line layered labels interface insights information indicators includes graphs gradient gadget futuristic font financial featuring drawing document displaying digital diagram design data colors circular charts cartoon business brand blue bar background appears analytics aigenerated advertising additional accent |
||||||||||||||||||||||||||||||||||||||||
|
||||||||||||||||||||||||||||||||||||||||
Data visualization interface with various charts and graphs on a blue gradient background. Includes line graphs, bar charts, and pie charts, displaying information with red and blue accent colors. The graphs are visually layered, featuring data points and trend lines. Small numeric labels and circular indicators provide additional data insights. The interface appears digital and futuristic, possibly representing business analytics or financial data. |
||||||||||||||||||||||||||||||||||||||||
Stockphotos.ro (c) 2025. All stock photos are provided by Dreamstime and are copyrighted by their respective owners. |