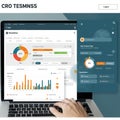
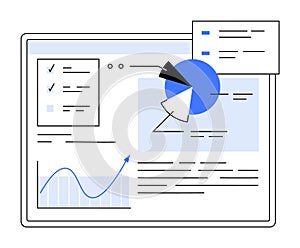
data visualization dashboard with pie chart line graph and document elements |
||||||||||||||||||||||||||||||||||||||||
| navigate by keyword : blue technology connectivity vector digital placeholder white background sleek black minimalistic professional checkmarks evaluation productivity management gray efficiency information computer screen interactive organized document progress elements graph presentation chart report lines interface corporate flow pointer pie monitor data analytics monitoring visualization text concise line business analysis project tracking performance review charting summary bstyle |
||||||||||||||||||||||||||||||||||||||||
|
||||||||||||||||||||||||||||||||||||||||
| Computer screen with charts, graphs, and documents emphasizing data analytics. Ideal for presentations, reports, business analysis, project tracking, performance review. Clean, modern style. |
||||||||||||||||||||||||||||||||||||||||
|
Stockphotos.ro (c) 2025. All stock photos are provided by Dreamstime and are copyrighted by their respective owners. |

||||||||||||||||||||||||||||||||||||||||