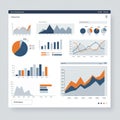
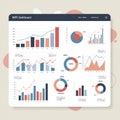
data dashboard displaying various visualizations including pie charts line graphs |
||||||||||||||||||||||||||||||||||||||||
| navigate by keyword : visualizations text sketch presentation poster pie organ number logo line including graphs font drawing document displaying diagram data dashboard circle charts cartoon brand advertising |
||||||||||||||||||||||||||||||||||||||||
|
||||||||||||||||||||||||||||||||||||||||
| Abstract design featuring interwoven orange and gray arrows. Various icons, including an eye, target, computer screen, and phone, are scattered throughout. The arrows and icons suggest the flow of information, possibly representing different aspects of data or communication processes. The overall layout is dynamic and complex, conveying movement and connectivity. |
||||||||||||||||||||||||||||||||||||||||
|
Stockphotos.ro (c) 2025. All stock photos are provided by Dreamstime and are copyrighted by their respective owners. |
||||||||||||||||||||||||||||||||||||||||