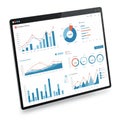
data analytics dashboard displaying charts and graphs tablet screen generated

navigate by keyword : data analytics dashboard charts graphs tablet screen business technology information statistics marketing finance report digital analysis performance metrics trends visualization infographic intelligence financial market research growth progress software application interface

Data Analytics Dashboard Displaying Charts and Graphs on Tablet Screen AI generated. Royalty Free Stock Photo
A digital tablet displaying a data dashboard with various charts and graphs. The Royalty Free Stock Photo
Tablet displaying a KPI dashboard with various charts and graphs. The screen shows Royalty Free Stock Photo
Tilted tablet screen displaying a digital dashboard with financial graphs and data Royalty Free Stock Photo
Tablet screen displaying various data visualizations, including bar charts, line graphs, Royalty Free Stock Photo
Digital Tablet Displaying Business Analytics Dashboard With Charts and Graphs Royalty Free Stock Photo
A tablet displaying a comprehensive dashboard with various data visualizations. It Royalty Free Stock Photo
Data Analytics Dashboard Displaying Charts and Graphs on Tablet Screen AI generated.
Tablet displaying a colorful business analytics dashboard. The screen features circular Royalty Free Stock Photo
A tablet lies on a dark surface displaying an advanced data analytics dashboard. The Royalty Free Stock Photo
A tablet displaying an interactive data dashboard with graphs and charts is placed on the table in front of it Royalty Free Stock Photo
Tablet on a dark surface displaying complex data visualizations. Screen features Royalty Free Stock Photo
Tablet displaying a digital dashboard with a sleek interface. Featuring circular graphs, Royalty Free Stock Photo
Tablet displaying a digital dashboard with various data visualizations. Includes bar Royalty Free Stock Photo
A digital tablet displaying a futuristic data dashboard lies on a dark surface. The Royalty Free Stock Photo
A tablet displays a modern data analytics dashboard The screen shows various charts and graphs in vibrant teal and pink visualizing key performance indicators and data trends Ideal for illustrating business intelligence or financial reporting concepts AI generated.


Stockphotos.ro (c) 2025. All stock photos are provided by Dreamstime and are copyrighted by their respective owners.