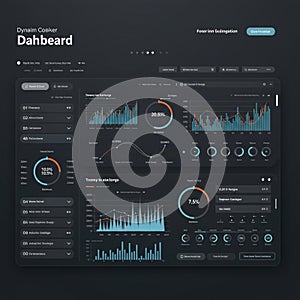
dashboard interface displaying various data visualizations including line and bar |
||||||||||||||||||||||||||||||||||||||||
navigate by keyword : visualizations userfriendly trend traffic tracking text sliders sections screenshot scheme presentation present poster performance percentage panels orange number multiple multimedia monitoring modern metrics manipulation line layout interface interactive intended indicators including graphs games gadget font features electronics effectively document displaying diagram design data dashboard dark control color clean circular charts buttons brand blue bar analytics analysis aigenerated advertising accents |
||||||||||||||||||||||||||||||||||||||||
|
||||||||||||||||||||||||||||||||||||||||
Dashboard interface displaying various data visualizations, including line and bar graphs with percentage indicators. The design uses a dark color scheme with blue and orange accents. It features multiple sections for tracking different metrics, such as traffic percentage and trend analysis. Circular percentage charts and control panels with sliders and buttons are present for interactive data manipulation. The layout is clean, modern, and user-friendly, intended for monitoring analytics or performance metrics effectively. |
||||||||||||||||||||||||||||||||||||||||
Stockphotos.ro (c) 2025. All stock photos are provided by Dreamstime and are copyrighted by their respective owners. |