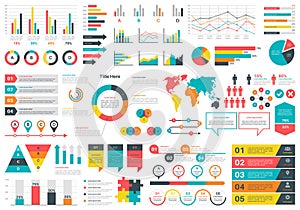
infographics charts financial analysis data graphs and diagram marketing statistic workflow modern business |
||||||||||||||||||||||||||||||||||||||||
navigate by keyword : abstract analysis bar business charting charts circle concept corporate cycle data diagram economic education elements finance financial flat forecast graphics graphs group icon illustration info infographics investment layout line marketing modern number percent point power presentation process profit progress radial report set simple statistic stats symbol template timeline vector workflow |
||||||||||||||||||||||||||||||||||||||||
|
||||||||||||||||||||||||||||||||||||||||
Infographics charts. Financial analysis data graphs and diagram, marketing statistic workflow modern business presentation elements vector investment progress icon set |
||||||||||||||||||||||||||||||||||||||||
Stockphotos.ro (c) 2025. All stock photos are provided by Dreamstime and are copyrighted by their respective owners. |