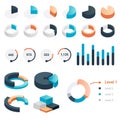
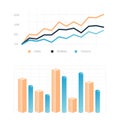
graphic charts statistic bars and circle diagrams for data presentation comparison histogram colorful analytic graphs

navigate by keyword : infographic diagram chart graph statistic infograph data process business presentation finance number analysis progress info comparison report flowchart infochart information histogram bar scheme economy percent analytic growth pie visualization management step circle level option line simple flat shape graphic colorful modern minimal vector layout element abstract design isolated set

Graphic charts. Statistic bars and circle diagrams for data presentation. Comparison histogram. Colorful analytic graphs Royalty Free Stock Photo
Graphic charts. Infographic statistic bars and circle diagrams for data presentation. Comparison histogram elements Royalty Free Stock Photo
Graphic charts. Infographic statistic bars and diagrams for data presentation, comparison histogram elements. Types set Royalty Free Stock Photo
Graphic charts. Infographic statistic bars and diagrams for data presentation. Comparison histogram elements. Types set Royalty Free Stock Photo
Graphic charts. Infographic statistic bars and diagrams for data presentation, comparison histogram elements. Types set of Royalty Free Stock Photo
   
   
Graphic charts. Statistic bars and circle diagrams for data presentation. Comparison histogram. Colorful analytic graphs


Graphic charts. Statistic bars and circle diagrams for data presentation. Comparison histogram elements. Isolated colorful analytic graphs. Business information visualization. Vector infographics set


Stockphotos.ro (c) 2025. All stock photos are provided by Dreamstime and are copyrighted by their respective owners.