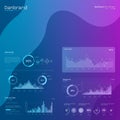
futuristic data visualization with graphs and analytical elements |
||||||||||||||||||||||||||||||||||||||||
navigate by keyword : aesthetic analysis analytical analytics app background business charts circles colors creativity dashboard data datadriven design digital elements explore featuring futuristic gradient graphical graphs illustrations infographic information insights interactive interface lines metrics modern patterns perfect performance presentation presentations reports shapes showcasing software statistical statistics tech technology tools trends vibrant visual visualization web |
||||||||||||||||||||||||||||||||||||||||
|
||||||||||||||||||||||||||||||||||||||||
Explore a vibrant and modern data visualization design featuring interactive graphs and analytical elements, perfect for showcasing digital analytics in presentations |
||||||||||||||||||||||||||||||||||||||||
Stockphotos.ro (c) 2025. All stock photos are provided by Dreamstime and are copyrighted by their respective owners. |