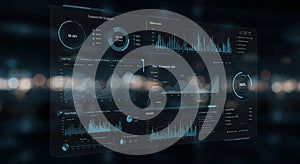
digital interface displays various data analytics featuring multiple charts and

navigate by keyword : white visualization trends text suggests statistical stage signage sections screenshot scientific purposes presentation poster pie person percentages organized multiple multimedia modern metrics line light layout labeled interface information including hightech headers graphs graphics games gadget font figures featuring environment elements displays digital digit design data darkthemed darkness conveying charts business brand blue bar analytics analysis aigeneratedal aigenerated advertising

A digital interface displays various data analytics, featuring multiple charts and Royalty Free Stock Photo
A futuristic digital dashboard with multiple data panels featuring graphs, charts, and Royalty Free Stock Photo
Futuristic user interface design featuring a layered digital dashboard. It includes Royalty Free Stock Photo
Futuristic digital interface with a dark background, featuring circular and linear graphs Royalty Free Stock Photo
A black tablet showing a user interface with various app icons and text labels on its Royalty Free Stock Photo
   
Futuristic AI Control Panel Royalty Free Stock Photo
A digital interface displays various data analytics, featuring multiple charts and
Financial Analytics Dashboard On Screen, Data Visualization Royalty Free Stock Photo
Futuristic data analysis lab with glowing screens and digital projections. Royalty Free Stock Photo
Professional data analysis workstation with multiple monitors displaying financial graphs and charts during daylight Royalty Free Stock Photo
AI Analyst at Work Futuristic Robot Processing Big Data Royalty Free Stock Photo
A computer screen with a futuristic interface on it Royalty Free Stock Photo
AI-Generated Data Visualization Royalty Free Stock Photo
A digital interface displays various data analytics, featuring multiple charts and graphs, including pie charts, line graphs, and bar graphs. The layout is dark-themed with blue and white text and graphics, conveying information such as percentages, metrics, and trends. Elements are organized into sections, each labeled with headers and statistical figures. The overall design suggests a modern, high-tech environment for data visualization and analysis, possibly for business or scientific purposes.


Stockphotos.ro (c) 2025. All stock photos are provided by Dreamstime and are copyrighted by their respective owners.