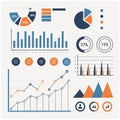
comprehensive set charts graphs and icons for data visualization

navigate by keyword : visualization values understanding triangular tools structured statistical set representing print pie person percentage orange numerical metrics line infographic includes include icons gray graphs format financial figure featuring elements easy data comprehensive colors clear circles charts carrying business briefcase blue bar arranged area

Comprehensive set of charts, graphs, and icons for data visualization. Royalty Free Stock Photo
Comprehensive set of charts, graphs, and icons for data visualization Royalty Free Stock Photo
Comprehensive set of charts, graphs, and icons for data visualization. Royalty Free Stock Photo
Collection of isometric line icons for comprehensive data analysis Royalty Free Stock Photo
Comprehensive set of charts, graphs, and icons for data visualization. Royalty Free Stock Photo
Comprehensive set of charts, graphs, and icons for data visualization.
Comprehensive set of charts, graphs, and icons for data visualization. Royalty Free Stock Photo
Stunning Infographic Elements for Data Visualization A Collection of Colorful Charts Graphs and Icons Perfect for Royalty Free Stock Photo
Comprehensive set of charts, graphs, and icons for data visualization. Royalty Free Stock Photo
Infographic featuring various charts and graphs. Includes bar charts, pie charts, line graphs, and icons representing financial and business metrics. Predominantly uses blue, orange, and gray colors. Elements include percentage circles, triangular area graphs with numerical values, a figure of a person carrying a briefcase, and different data visualization tools. Arranged in a clear, structured format for easy understanding of statistical data.


Stockphotos.ro (c) 2025. All stock photos are provided by Dreamstime and are copyrighted by their respective owners.