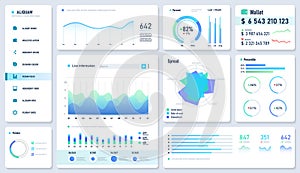
web dashboard statistic graphs data charts and diagrams infographic template analytics vector mockup |
||||||||||||||||||||||||||||||||||||||||
navigate by keyword : graph chart dashboard data infographic screen statistic line mobile template financial vector business diagram background icon design banner marketing finance graphic menu web presentation management app economy system application interface information column analysis curve progress platform administration analytic achievement activity analyzing info kpi panel plan report |
||||||||||||||||||||||||||||||||||||||||
|
||||||||||||||||||||||||||||||||||||||||
Web Dashboard UI, Statistic Graphs, Data Charts and Diagrams Infographic Template. Analytics UX Dashboard. Vector MockupCompatible with Adobe Illustrator version 10, No raster and is easy to edit, Illustration contains transparency and blending effects. |
||||||||||||||||||||||||||||||||||||||||
Stockphotos.ro (c) 2025. All stock photos are provided by Dreamstime and are copyrighted by their respective owners. |