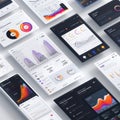
visualization data through interactive mobile application showcasing charts and graphs

navigate by keyword : data visualization mobile application graphs charts analytics pie chart smartphone interactive color spectrum technology user interface digital analysis design information statistics trend performance metrics interpretation programming software representation creative modern colorful tools business intelligence tech trends experience graphics augmented reality insights coding management generated

Visualization of Data Through an Interactive Mobile Application Showcasing Charts and Graphs Royalty Free Stock Photo
Colorful Data Visualization on Smartphone with Graphs and Charts Royalty Free Stock Photo
Modern User Interface Design for Data Visualization and Analytics Royalty Free Stock Photo
A digital interface showcasing customizable app data visualizations with colorful graphs and charts, Customizable app data with Royalty Free Stock Photo
User Interface Design Showcasing Various Data Visualization Elements on Mobile Devices During a Night Setting Royalty Free Stock Photo
Data Analysis on Smartphone Screen Royalty Free Stock Photo
Visualization of Data Through an Interactive Mobile Application Showcasing Charts and Graphs
Mobile Learning App Displayed on Smartphone Showcasing Colorful Graphs and Statistics for Data Analysis and Tracking Royalty Free Stock Photo
A collection of smartphones displaying colorful, modern UI/UX designs with graphs, charts, and profile interfaces, showcasing a Royalty Free Stock Photo
Data Analysis on Smartphone Screen Royalty Free Stock Photo
Modern Mobile Health App Displaying Colorful User Analytics Data Royalty Free Stock Photo
Wellness Dashboard Displayed on a Mobile Phone Screen With Vibrant Graphics Showcasing Health Data and Analytics for Royalty Free Stock Photo
A mobile device displays vibrant data visualizations, including a colorful pie chart and detailed graphs, highlighting analytical insights in real time. AI generated


Stockphotos.ro (c) 2025. All stock photos are provided by Dreamstime and are copyrighted by their respective owners.