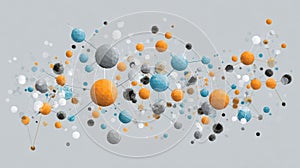
visual representation interconnected spheres and nodes vibrant colors illustrating complex data relationships |
||||||||||||||||||||||||||||||||||||||||
| navigate by keyword : data visualization spheres connections geometric patterns colors network design technology abstract art relationships interactive modeling graphics colorful nodes minimalism creativity visual effects science mathematics digital contemporary innovation computation aesthetics information structure analysis communication symmetry dynamics representation complexity shapes ethereal engagement user experience concept generated |
||||||||||||||||||||||||||||||||||||||||
|
||||||||||||||||||||||||||||||||||||||||
| A visual display features interconnected spheres in various colors, showing dynamic relationships in a data-driven environment. AI generated |
||||||||||||||||||||||||||||||||||||||||
|
Stockphotos.ro (c) 2025. All stock photos are provided by Dreamstime and are copyrighted by their respective owners. |
||||||||||||||||||||||||||||||||||||||||