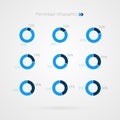
vector percentage infographics percent pie charts circle diagrams isolated |
||||||||||||||||||||||||||||||||||||||||
| navigate by keyword : business chart charts circle complete data development diagram diagrams download financial green grey growth icon illustration infographic infographics isolated percent percentage progress report sign symbol vector white |
||||||||||||||||||||||||||||||||||||||||
|
||||||||||||||||||||||||||||||||||||||||
| Vector percentage infographics. 10 15 20 25 30 35 40 45 50 55 60 65 70 75 80 85 90 percent pie charts. Circle diagrams isolated. Business illustration |
||||||||||||||||||||||||||||||||||||||||
|
Stockphotos.ro (c) 2025. All stock photos are provided by Dreamstime and are copyrighted by their respective owners. |
||||||||||||||||||||||||||||||||||||||||