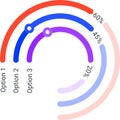
vector illustration colorful diagram representing market share statistics dashboard chart and infographic |
||||||||||||||||||||||||||||||||||||||||
navigate by keyword : chart diagram graph infographic statistics data visualization percentage business analysis marketing finance information report presentation vector illustration design colorful gradient modern abstract element icon symbol corporate strategy planning performance growth trend market share dashboard analytics progress success target goal achievement measurement indicator kpi |
||||||||||||||||||||||||||||||||||||||||
|
||||||||||||||||||||||||||||||||||||||||
Vector illustration of a colorful diagram representing market share, statistics dashboard chart, and infographic elements, perfect for visualizing data and trends |
||||||||||||||||||||||||||||||||||||||||
Stockphotos.ro (c) 2025. All stock photos are provided by Dreamstime and are copyrighted by their respective owners. |