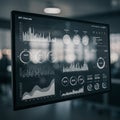
various data graphs and charts digital screen display trends over time the |
||||||||||||||||||||||||||||||||||||||||
navigate by keyword : vibrant trends time text teal suggesting spots signage sets screenshot screen representing presence pie performance number multimedia line light indicates includes hues green graphs glowing generated games gadget font focus flow financial feel enhancing electronics dynamic display digital design data dark connections comparison colors closely charts blue bar background arranged analytics analysis adds |
||||||||||||||||||||||||||||||||||||||||
|
||||||||||||||||||||||||||||||||||||||||
Various data graphs and charts on a digital screen display trends over time. The image includes line graphs, bar charts, and pie charts with green, blue, and teal hues. The charts are closely arranged, suggesting analysis and comparison of data sets. The background is dark, enhancing the vibrant colors of the graphs, which indicates a focus on digital analytics or financial performance. The presence of glowing spots adds a dynamic feel, possibly representing data flow or digital connections. |
||||||||||||||||||||||||||||||||||||||||
Stockphotos.ro (c) 2025. All stock photos are provided by Dreamstime and are copyrighted by their respective owners. |