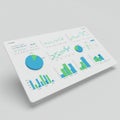
sleek digital dashboard displays key performance indicators various graphs |
||||||||||||||||||||||||||||||||||||||||
navigate by keyword : world white vividness visualizations trends tracking text technologyrelated suggests stage sleek signage screenshot realtime providing presentation poster pie person performance percentages overview orange night monitoring metrics maps line like light key interface information indicators include ideal graphs global generated futuristic font enhancing elements displays digital design data dashboard darkness dark cover comprehensive charts business brand bar banner background art analysis advertising advanced activities |
||||||||||||||||||||||||||||||||||||||||
|
||||||||||||||||||||||||||||||||||||||||
A sleek digital dashboard displays key performance indicators. Various graphs, charts, and world maps cover metrics like percentages, trends, and global data. The background is dark, enhancing the vividness of the orange and white data visualizations. Elements include bar graphs, line graphs, pie charts, and world maps, providing a comprehensive overview of performance metrics. The futuristic interface suggests advanced data analysis and real-time information tracking, ideal for monitoring business or technology-related activities. |
||||||||||||||||||||||||||||||||||||||||
Stockphotos.ro (c) 2025. All stock photos are provided by Dreamstime and are copyrighted by their respective owners. |