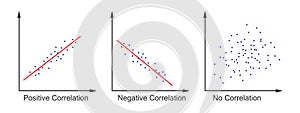
set scatter plot diagrams scattergrams with different types variables correlation data points plotted |
||||||||||||||||||||||||||||||||||||||||
navigate by keyword : scatter plot correlation diagram scattergram scatterplot icon graph chart algorithm analysis infographic flat bubbles circles statistics analytics regression map math coefficient linear value hight science model data dot range mathematical coordinates axis point relationship isolated illustration vector positive variable |
||||||||||||||||||||||||||||||||||||||||
|
||||||||||||||||||||||||||||||||||||||||
Set of scatter plot diagrams. Scattergrams with different types of variables correlation. Data points plotted on a horizontal and a vertical axis on Cartesian plane. Vector flat illustration |
||||||||||||||||||||||||||||||||||||||||
Stockphotos.ro (c) 2025. All stock photos are provided by Dreamstime and are copyrighted by their respective owners. |