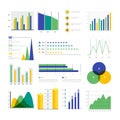
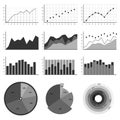
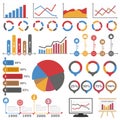
set color infographic elements vector diagrams and graphs statistics data |
||||||||||||||||||||||||||||||||||||||||
navigate by keyword : abstract analysis analytic background business cartogram chart combination concept creative cycle data design development diagram document economy element finance financial flat forecast graph graphic growth icon idea illustration info infographic information interface isolated money plan process profit progress radial report research set statistic stats stock symbol template timeline trend vector |
||||||||||||||||||||||||||||||||||||||||
|
||||||||||||||||||||||||||||||||||||||||
Set of color infographic elements. Vector diagrams and graphs, statistics of data. Use in website, flyer, corporate report, presentation, advertising, marketing etc. |
||||||||||||||||||||||||||||||||||||||||
Stockphotos.ro (c) 2025. All stock photos are provided by Dreamstime and are copyrighted by their respective owners. |