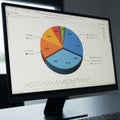
pie chart displaying data various segments with different percentages labeled |
||||||||||||||||||||||||||||||||||||||||
navigate by keyword : yellow theme text teal suggesting small shows segments sections screenshot representing red presentation present plan placeholders pie person percentages organ orange multimedia marked map logo lines line like legend left lead labeled infographic including icons hues graph generated gear four font elements drawing document displaying diagram design descriptions data consistency connected comparative colorful colorcoded circle chart categories cartoon cart camera brand bottom bar appears advertising |
||||||||||||||||||||||||||||||||||||||||
|
||||||||||||||||||||||||||||||||||||||||
Pie chart displaying data in various segments with different percentages labeled, including sections marked 70%, 65%, 37%, 30%, 20%, and 18%. Connected lines lead to icons representing elements like a camera, person, cart, gear, and circle graph, each with placeholders for descriptions. A bar graph at the bottom left shows comparative data across four categories. The chart appears colorful, with hues like orange, teal, red, and yellow. A small color-coded legend is present, suggesting theme consistency across the infographic. |
||||||||||||||||||||||||||||||||||||||||
Stockphotos.ro (c) 2025. All stock photos are provided by Dreamstime and are copyrighted by their respective owners. |